

Cape Florida Lighthouse, Key Biscayne Florida submitted by Dave MacNicol

Dave and Diane MacNicol with their son David Jr., daughter-in-law Megan, and granddaughter Grace.
The Cape Florida Lighthouse, located in Bill Baggs Cape Florida State Park on Key Biscayne, is a 95-foot, historic beacon built in 1825 that is celebrating its 200th anniversary. It is the oldest standing structure in Miami-Dade County, offering guided tours to the top for panoramic views of the Atlantic Ocean and Biscayne Bay.
*Feel free to send us your photos of Lighthouses to be featured in our weekly market observations.
China taking over
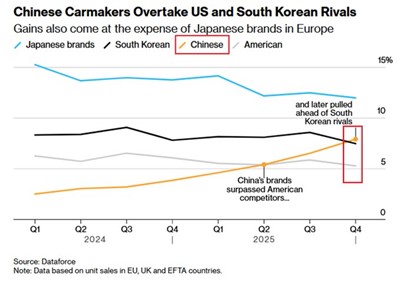
China has officially begun to take over the European import auto market. Last year, China’s brands surpassed both the U.S. and South Korea in terms of share of auto sales in Europe. Chinese brands now account for 10% of all passenger cars sold in Europe, a record high. China’s market share surpassed that of the U.S. and South Korea for the first time ever. China’s electric-vehicle market presence led the way, more than doubling in Europe last year.
Japanese brands remain the leaders in terms of international producers in Europe, but with China’s current growth, they are expected to surpass Japan as early as sometime this year.
China is not only creating a domestic market for its vehicle sales, but they are also taking over the global market. It is no surprise that when markets are opened to Chinese automakers, they grab a chunk of market share. Chinese vehicles are amongst the cheapest in the world, and many consumers look to their vehicles as cheap alternatives to domestic made vehicles. These Chinese brands are highly competitive and are impacting demand from other markets. China’s competitiveness in the auto industry is a reason why the U.S. has not allowed Chinese companies to sell in their market, as demand for domestically made vehicles would slow, which would negatively impact employment in the domestic auto industry. This line of thinking can also explain why the Trump administration was so mad at the Canadian government for announcing the commencement of Chinese auto sales in their country. According to recent announcements, the Canadian government will allow 49,000 Chinese EVs to be sold into the country at a single-digit tariff rate per year. Currently, the tariff rate on Chinese vehicles in Canada is over 100%. 49,000 vehicles are about 20% of Canada’s annual combined battery EV and hybrid market (according to Dunsky Energy and Climate Advisors).
Canada’s lifting of restrictions on Chinese EVs is part of a plan that Canada hopes will boost its auto manufacturing industry. Canada is reportedly hoping for Chinese investment in its auto industry, which has been struggling to cope with new tariffs. Minister Melanie Joly of the Carney government stated that the eventual goal is to see a Chinese company form a joint venture with Canadian firms to open an assembly factory and export vehicles to the world.
Expect many Canadians to take full advantage of cheap Chinese EVs, according to Nanos Research Group, 53% of Canadians would not avoid buying a car because it’s a Chinese EV.
We do not hold any shares of any Chinese companies, including in the auto space. We still believe there are far too many risks in the Chinese market and will continue to avoid it. We believe there are many more attractive opportunities across other emerging markets with much lower risk, which we continue to analyze and hold.
The K-shape economy
If you follow this publication or economic news, you more than likely have heard of the K-shaped economy. For those that do not know, the k-shaped economy is an economic theory that divides the economy into two arms (groups), the arm on the “K” going up illustrates the good fortunes and prosperity of the upper class and higher income households (which tend to invest in financial markets), the arm on the “K” going down represents financial conditions for the rest of the economy which are breaking down.
This week, Bloomberg Opinion released a study that looked at the K shaped economy. They highlighted a few statistics that back their opinion. Personal savings are on the decline, savings rates as a percentage of disposable income are on the decline, and delinquency rates on loans (ranging from mortgages to credit cards) are on the rise. Delinquency rates on loans rose to 4.8% in the fourth quarter, the highest since 2017. The personal savings rate in the U.S. tumbled from 5.5% in April 2025 to 3.5% in November, the lowest since 2008 (excluding Covid-19 data error disruptions).
These negative data points are a reflection of the lower and middle income earners in America, and they show that Americans are hurting. This all comes while the stock market is at all-time highs, which benefits the highest-earning Americans the most.
What does this mean for us? Dwindling savings mean less cushion in the wallets for Americans and eventually a slowdown in spending, especially on discretionary items. We have been actively rotating into defensive names as data points like these continue to be released. We think they will greatly outperform discretionary names over the next 12-18 months. The first point to watch will be earnings from Q1, which begin to be reported in April.
American exceptionalism
Americans are proud of many things. We will not comment on them all, but we do believe that American exceptionalism is a driver of recent returns across markets. The U.S. equity market is a behemoth. It’s the largest in the world. Domestic investors buy it. International investors buy it. They even buy it when it’s much more expensive than in other markets. Why? It provides stronger and more stable growth, and it provides exposure to some of the world’s largest and revolutionary companies.
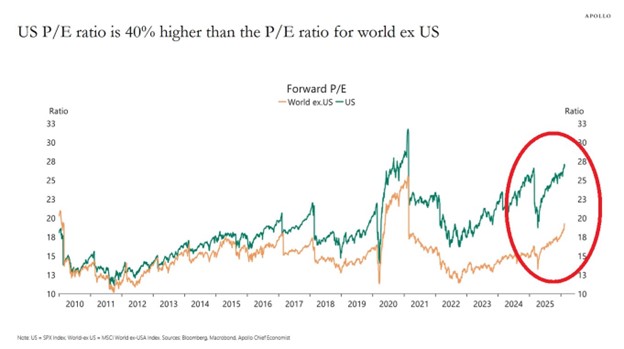
However, today the U.S. market is extremely expensive; on a forward basis, the S&P 500 is trading at 28 times earnings, according to Bloomberg and Macrobond. This is the highest since the Covid-19 spike. Excluding that period, it is the most expensive market since the 2000 Dot Com bubble. By comparison, the world excluding U.S. equities is trading at 20 times forward earnings. This index is trading at one of its highest levels since 2008. Today’s P/E spread between the U.S. market and the world is at one of its highest levels in the last 20 years.
A rotation away from the U.S. has already begun, and we expect it to accelerate. Many international equity markets outperformed the U.S. last year, and their ETFs saw massive flows. We think diversifying equity exposure is extremely important in today’s expensive and volatile market. There are lots of attractive markets and companies based around the world that are often ignored by many investors. We have always followed international markets and selected international companies to diversify our clients’ exposure away from the behemoth that is the U.S.
We believe maintaining some exposure to U.S. equities remains important, as select American companies continue to demonstrate exceptional fundamentals and long-term growth potential. Our portfolios maintain diversified U.S. exposure, though we remain attentive to the evolving macroeconomic and valuation risks inherent in today’s market environment.
We will say that diversifying away from the U.S. does not eliminate equity risk. Today, equities in general are trading at elevated valuations, and even international equities are trading above their historical valuation means.
One can limit their equity risk by investing in other asset classes like private market assets or through tail risk protection. At MacNicol & Associates Asset Management, we have investment vehicles that invest in alternative markets and tail risk protection. Contact us today if you want to learn more about either of these product offerings.
Fund Manager sentiment
The recent Bank of America global fund manager survey paints a euphoric picture in terms of market sentiment. According to the survey, fund managers are the most bullish since June 2021. The sentiment gauge below rose above 8 on the chart above. Sentiment is measured by the Bank of America by cash levels, stock exposure, and growth expectations.
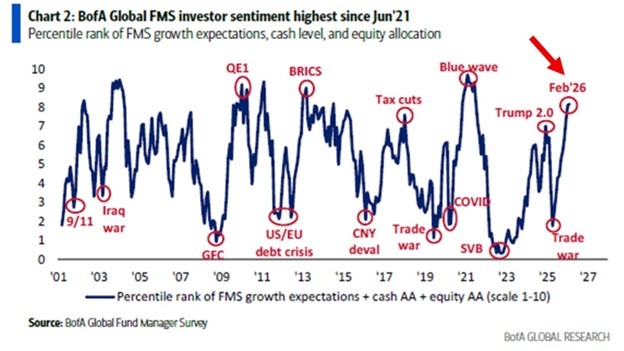
Last April, the same metric was in bearish territory as Trump rolled out his tariff strategy.
During the century, market sentiment has only been this positive a few times. Is this level of euphoria sustainable, and what will cause it to reverse? Fund managers digest all data and change their opinions rapidly.
Gas giant reports
EQT Corporation, a Pennsylvania based natural gas producer that we have talked about in the commentary’s history, reported its earnings on Tuesday afternoon. EQT is an integrated pure play Appalachian producer.
The company reported a double beat. Fourth quarter adjusted earnings-per-share came in at $0.90, increasing 34% YoY. Adjusted operating revenue came in 1.4% higher than analyst expectations and increased 15% YoY. The strong figures were driven by higher volume sales and higher realized natural gas prices. The average realized price was $3.44 per thousand cubic feet of natural gas equivalent (Mcfe), up from the year-ago figure of $3.01. EQT’s operating cash flow totaled $1.55 for the quarter, increasing 26% YoY. Free cash flow totaled $857 million, increasing 46% YoY. This quarter’s figures reflects record setting performance across drilling and completion. 2025 average well costs were down 13% YoY.
EQT forecasts $3.5 billion in 2026 free cash flow at recent strip pricing. Here is EQT’s forecasted free cash flow sensitivity guidance for 2026:
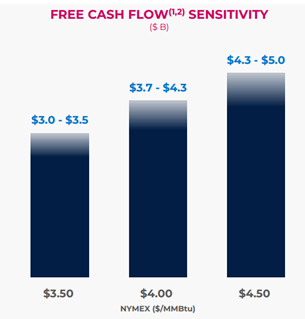
Source: EQT Corporate Presentation Q4 Earnings 2025
Capital expenditures came in slightly lower than the midpoint guidance estimate, benefiting from operational efficiency and lower infrastructure spending. The company reported $7.7 in net debt at the end of Q4 and forecast to exit 2026 with $4.6 billion in net debt at recent strip pricing. EQT has materially deleveraged its balance sheet through free cash flow since Q3 2024 (when it closed its Equitrans acquisition). EQT has stated in the past that it will be opportunistic moving forward when it comes to share repurchases. With how shares performed in 2025, it’s no surprise
On a relative basis, EQT continues to outperform its Appalachian peers, reporting 35% higher well productivity (measured by compression investments and production). The Appalachian gas market continues to display strong fundamentals, eastern storage levels for gas are below 5-year lows, and demand outlook continues to improve, setting the stage for long-term sustainable growth. FactSet’s analyst averages paint a strong forward valuation outlook in terms of earnings and cash flows.
EQT highlighted data center demand growth as a key driver for the company. EQT expects U.S. natural gas demand to increase by more than 30% by 2030, driven by data centers, AI demand, and retiring coal plants.
Shares moved higher on the strong figures reported. EQT shares have been on fire over the last month as energy prices have moved higher in recent months due to tighter supply constraints, and geopolitical risks have heightened. Natural gas prices have pulled back recently due to the milder weather. Shares of producers across the industry have been outperformers recently, as earnings for the most part in energy have been strong in recent quarters, and as investors rotate capital from high growth and technology into other sectors.
We will note that over the last 5 years, EQT has the highest average return in March, with April and May also having above average return profiles.
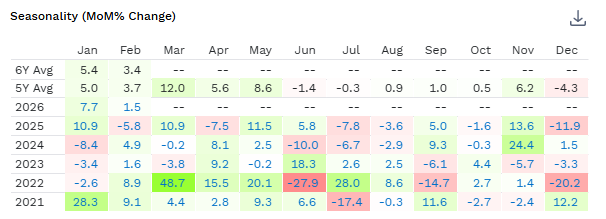
Source: FactSet
We continue to like EQT due to its growth prospects, operational efficiency, and the tailwinds across the natural gas industry. Despite trading at a slight premium relative to earnings and EV/EBITDA compared to its comps, we like EQT’s business model, which is built on scaling, cost position, and leverage to structural natural gas demand. We think the firm has lower risk and will continue producing higher free cash flows versus peers.
Disclaimer: MacNicol & Associates Asset Management holds shares of EQT Corporation (EQT: NYSE) across various client accounts.
Winners vs. losers in AI
The birth and growth of AI has led to many winners across the industry, but it has also led to many losers. AI has negatively impacted many software companies that provide software-as-a-service:
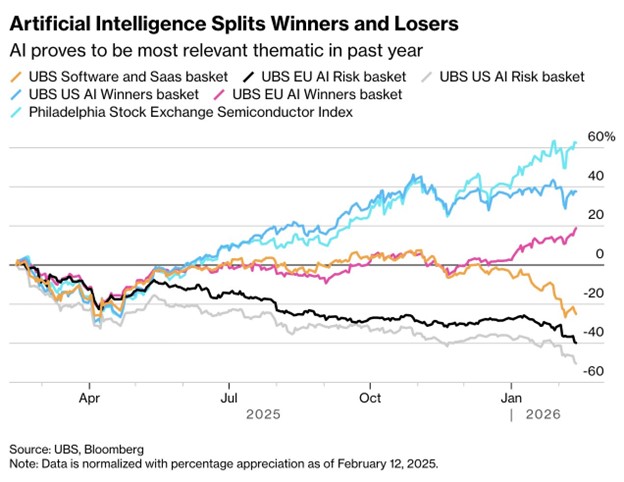
SaaS firms were once the darlings of Wall Street. However, today, they are major laggards across public markets as their moat evaporates in front of their eyes. AI disruptions are causing analysts and investors to reprice dated SaaS models fast. This decrease in the stock prices of SaaS companies is due to lower implied growth rates, causing multiple compressions.
Load up on small caps?
We end this week’s publication off with an interesting chart from Bank of America, which tracks large-cap versus small-cap performance over the last 40+ years. Large caps that have outperformed for quite a period are now at levels not seen since the Dot Com bubble. Is now the time to load up on some quality small caps? You tell us:
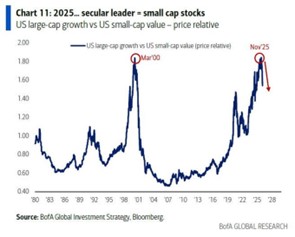
We are looking across the market for strong opportunities and looking to diversify away from the mainstay large caps that many investors have benefitted for more than a decade.
RRSP deadline
For our Canadian investors, we wanted to remind you that the 2025 RRSP contribution deadline is Monday, March 2, 2026. Contributions made between January 1, 2026, and March 2, 2026, can be deducted on your 2025 tax return. The 2025 RRSP contribution limit is $32,490, or 18% of your 2024 earned income, whichever is less.
We also wanted to remind our investors that 2026 is a new year, and that means new TFSA and FHSA contribution room. Investors can top up their TFSAs with $7,000 and their FHSAs with $8,000 in 2026. Contact the CRA or check your latest Notice of Assessment to see your official contribution limit.Our product offerings go beyond traditional registered accounts including the Personal Pension Plan. We have a growing number of Personal Pension Plans, so if you are a PPP holder contact us today to contribute to your plan. If you are the owner of a successful business, the PPP is the best game in town.
What we are looking at next week
Next week, will again not have much in terms of substantive economic data; however, one key event may breathe some life into an otherwise dull market. Next week, the largest company in the world by market cap, and the posterchild for the “AI revolution”, Nvidia, reports Wednesday, February 25th, after the close. While we always wish to be optimistic, Nvidia is a company that has seen its valuation get way ahead of itself. The rise of the company’s stock price was due largely to unprecedented growth, something which has slowed down in recent quarters (Figure 1).
Figure 1: Nvidia’s revenue growth continues to be positive during its current cycle, but it has come down from the triple-digit highs it sustained during its meteoric rise.
While still positive, the revenue growth trend is waning, and if previous semiconductor cycles are any guide, a material slowdown in demand may see declining revenue growth for this important stock. The market has been going sideways for months now, and investors should be watching to see if there is any evidence, both in terms of numbers and/or guidance, that the AI revolution may be slowing down. Next week’s earnings from NVDA may hold the key to determine in which direction this sideways market eventually resolves.
MacNicol & Associates Asset Management
February 20th, 2026
Download in PDF format:


